Marketing often feels like guessing. You put money into ads, write blog posts, and send emails. But do you know what actually works? Google Analytics takes the guesswork out of marketing. It shows you real data about your visitors. You can see where they come from, what they do on your site, and why some people buy while others leave.
This guide will show you how to use Google Analytics to improve your marketing performance. You will learn simple steps to track the right things, understand your visitors, and make changes that bring real results.
Understanding the New Google Analytics
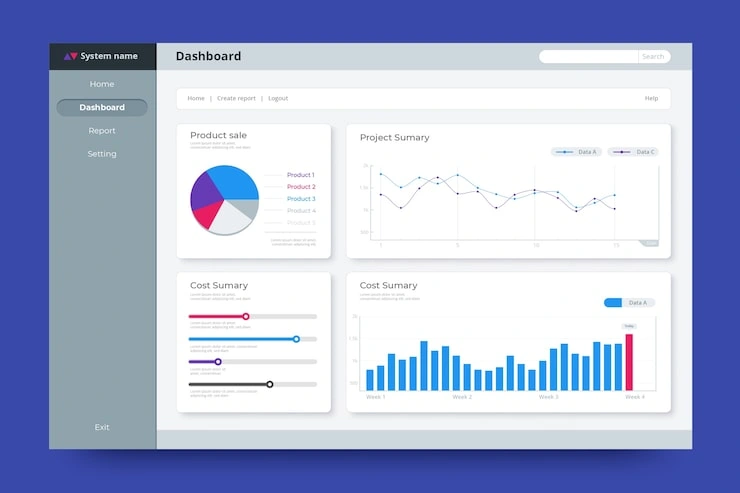
Google Analytics 4 is the latest version. It works differently than the old one. The old system tracked page views. The new system tracks events . An event is any action someone takes on your site. This could be clicking a button, watching a video, or filling out a form.
This change matters for your marketing. You can now see the full picture of what people do before they buy. You can track small actions that lead to bigger ones. This helps you understand your customers better and improve your marketing campaigns.
The new version also focuses more on privacy. It does not store IP addresses. This helps you follow privacy rules while still getting useful data . You just need to think more carefully about what events you want to track.
Read Also: How can Google Analytics events be used to track and improve sales leads?
Setting Up Your Analytics Correctly
Good data starts with good setup. If your setup is wrong, your decisions will be wrong too.
Get the Tracking Code on Your Site
First, you need to put the tracking code on every page of your website. You can do this in a few ways. The easiest way is using Google Tag Manager. This tool lets you manage all your tracking codes in one place . You can also add the code directly to your website files or use a plugin if you have a WordPress site.
Connect Your Other Google Tools
Google Analytics works better when you connect it to other Google tools. Link it to Google Ads. This lets you see which ads lead to sales . You can also connect it to Google Search Console. This shows you which search terms bring people to your site . These connections give you a complete view of your marketing performance.
Keep Your Data Longer
By default, Google Analytics only keeps user data for two months. You can change this to 14 months . This longer time helps you see trends and compare performance year over year. It also helps you understand buying cycles that take a long time.
Set Up Data Retention Correctly
You also need to think about how long you store event data. Go to Data Settings and set the retention period to the maximum . This ensures you have enough historical data to make good decisions.
Finding the Numbers That Actually Matter
Google Analytics gives you a lot of numbers. Most of them are not useful for making marketing decisions. Focus on these key numbers instead.
Total Users
This counts the number of different people who visit your site . Look at this number to see if your audience is growing. If new users are not increasing, you need to find new ways to bring people to your site.
Sessions and Sessions Per User
A session is a group of actions a person takes in a short time . Sessions per user shows how often people come back. More sessions per user means people find your content useful and want to see more.
Engagement Rate
This is one of the most important numbers in the new Google Analytics. A session counts as engaged when someone does one of these things :
Stays on your site for more than 10 seconds
Visits more than one page
Completes a conversion event
A low engagement rate means your content is not holding people's attention. You need to improve your content or make it easier to find.
Average Engagement Time
This shows how long people spend actively looking at your site . This is better than total time on site because it ignores times when people leave the tab open and do nothing. Long engagement time shows people find your content valuable.
Learning Where Your Visitors Come From
You need to know where your visitors come from to make smart marketing decisions. This is called acquisition analysis.
Use the Traffic Acquisition Report
Go to Reports, then Acquisition, then Traffic Acquisition . This report shows you which channels send visitors to your site. Channels include organic search, direct visits, social media, paid ads, and referrals from other sites.
Compare Different Channels
Look at which channels bring the most visitors. Then look at which channels bring the most engaged visitors. Sometimes a channel with fewer visitors brings better quality visitors. For example, maybe social media brings many visitors, but search brings visitors who actually buy things.
Use UTM Codes
UTM codes are tags you add to your links. They tell Google Analytics exactly where the traffic came from. This is very important for tracking your marketing campaigns . Use a consistent naming system. This makes it easy to compare different campaigns.
Here is a simple system to use:
This consistency makes your reports clear and useful.
Understanding What Visitors Do on Your Site
Knowing where visitors come from is just the start. You also need to know what they do once they get to your site.
Use the Pages and Screens Report
Go to Reports, then Engagement, then Pages and Screens . This shows you which pages get the most views and engagement. Sort by average engagement time. The pages at the top are your best content. Study these pages to see what makes them work.
Use Path Exploration
Path exploration is a powerful tool that shows the paths people take through your site . Go to Explore and choose Path Exploration. Start with "session start" as the beginning node. This creates a visual map showing common routes.
Look for places where people drop off. If many people leave after a certain page, you have a problem. Maybe the page is confusing. Maybe it loads slowly. Maybe the next step is not clear.
Look at Landing Pages
Your landing pages are the first pages people see when they come to your site. Go to Reports, then Acquisition, then Traffic Acquisition. Filter by landing page . A page that gets many visitors but has low engagement might have a problem. The page might not match what people were looking for. Fix the page or remove it from your marketing.
Setting Up Events and Conversions
Conversions are the actions you want people to take. This could be buying something, signing up for a newsletter, or filling out a form. In Google Analytics 4, these are called key events .
Define Your Key Events
Start with the most important actions first. What are your business goals? These are your macro-conversions. These might include product purchases, service signups, or quote requests .
Then think about smaller actions that lead to bigger ones. These are micro-conversions. These might include newsletter signups, adding items to a cart, or watching a product video . These smaller actions show that someone is interested. They help you spot potential customers early.
Set Up Events
Google Analytics automatically tracks some events. These include page views and form submissions . For other actions, you need to set up events.
You can do this in the Google Analytics interface. Go to Admin, then Events, then click Create event. Give your event a name. Then set conditions for when the event should trigger .
For example, you could create an event that triggers when someone visits a thank you page after a purchase. The condition could be page title containing "Thank you for your order."
Mark Events as Conversions
Once you have your events set up, go to Admin, then Events . Find your event and turn on the toggle under "Mark as conversion." This tells Google Analytics that this action is important to your business.
You can mark up to 30 events as conversions . Choose carefully. Focus on events that truly matter to your business.
Add Conversion Rate to Reports
By default, Google Analytics shows conversion counts but not rates. You can add conversion rate to your reports . Click the customize report icon, then add metrics. Choose either session conversion rate or user conversion rate.
Session conversion rate is sessions with conversions divided by total sessions. User conversion rate is users who converted divided by total users. Both give useful information.
Read: What are three ways that machine learning is used with data analytics?
Using Audiences to Target the Right People
Audiences are groups of users with something in common. You can use audiences to understand different types of visitors and to target them with marketing.
Create Custom Audiences
Go to Admin, then Audiences, and click New Audience . You can create audiences based on many conditions. Here are some examples:
People who added items to their cart but did not buy
People who visited your pricing page more than three times
People who downloaded a free guide but did not purchase
People who came from a specific marketing campaign
Use the Exclude Function
The exclude function is very useful. You can create an audience of people who added to cart. Then exclude people who completed a purchase . This gives you an audience of people who almost bought but did not. You can target these people with special offers or reminder emails.
Set the Right Membership Duration
This is how long people stay in your audience after they meet the conditions. The default is 30 days. But you might need a different time . Think about your business cycle. If you sell something people need quickly, a shorter time might be better. If you sell something people think about for a long time, a longer time might be better.
Finding and Fixing Problems
Google Analytics can help you spot problems before they become big issues.
Use Custom Insights
Custom insights are alerts you set up. They tell you when something changes . Go to the home page in Google Analytics and scroll down. Click create custom insights.
You can set alerts for things like:
No conversions for 24 hours
Sudden drop in traffic
Change in engagement rate
This helps you catch problems early. You can fix them before they hurt your business.
Use the Funnel Exploration Tool
Funnel exploration shows you where people drop off in a specific process . Go to Explore and choose Funnel Exploration. Set up the steps in your process. For example:
View product page
Add to cart
Begin checkout
Complete purchase
Look at the drop-off at each step. If many people drop off at the checkout step, you might have a problem with your checkout process. Maybe it is too long. Maybe people do not trust your payment system. Use this information to make improvements.
Check DebugView
DebugView is a tool for testing your tracking setup . It shows events in real time. This helps you make sure your events and conversions are set up correctly. Test new changes before you rely on the data.
Making Smarter Marketing Decisions
The goal of all this data is to make better decisions.
Compare Channels by Quality
Do not just look at which channel brings the most visitors. Look at which channel brings the most valuable visitors . A channel might bring fewer visitors but those visitors might be more likely to buy. Focus your budget on these high-quality channels.
Improve Your Content
Use the pages and screens report to see what content people engage with most. Create more content like this . If a blog post has high engagement, write more posts on similar topics. If a video gets many views, make more videos.
Test and Learn
Use Google Analytics to test changes. Make a change to your site. See if engagement improves. See if conversion rates go up . This could be changing a headline, moving a button, or simplifying a form. Keep what works. Change what does not work.
Connect Analytics to Your Marketing Tools
Send your Google Analytics data to your other marketing tools. Use conversions from Google Analytics to inform automated bidding in Google Ads . This helps you spend your ad budget more wisely.
A Practical Action Plan
Here is what to do right now.
This Week
Set up your Google Analytics correctly. Link it to Google Ads and Google Search Console. Check that your events and conversions are tracking properly. Use DebugView to test everything.
This Month
Review your top pages. Find what content gets the most engagement. Make more content like that. Create audience segments for your most valuable visitors. Use these audiences in your marketing campaigns.
This Quarter
Set up custom insights for your important metrics. Start using path exploration to find drop-off points. Fix the biggest problems first. Compare channel performance and reallocate your budget.
Ongoing
Check your key numbers weekly. Look at trends, not just single numbers. Keep testing and learning. Your analytics will get better over time as you collect more data.
Conclusion
Google Analytics is a powerful tool for improving marketing. It shows you what works and what does not. This removes the guesswork from marketing decisions. You can spend your budget where it has the most impact.
Start simple. Get your setup right. Focus on a few key numbers. Make changes based on what the data tells you. Over time, you will get better at using this tool.
 Wartian Herkku
Marketing often feels like guessing. You put money into ads, write blog posts, and send emails. But do you know what actually works? Google Analytics takes the guesswork out of marketing. It shows you real data about your visitors. You can see where they come from, what they do on your site, and why some people buy while others leave.
This guide will show you how to use Google Analytics to improve your marketing performance. You will learn simple steps to track the right things, understand your visitors, and make changes that bring real results.
Understanding the New Google Analytics
Google Analytics 4 is the latest version. It works differently than the old one. The old system tracked page views. The new system tracks events . An event is any action someone takes on your site. This could be clicking a button, watching a video, or filling out a form.
This change matters for your marketing. You can now see the full picture of what people do before they buy. You can track small actions that lead to bigger ones. This helps you understand your customers better and improve your marketing campaigns.
The new version also focuses more on privacy. It does not store IP addresses. This helps you follow privacy rules while still getting useful data . You just need to think more carefully about what events you want to track.
Read Also: How can Google Analytics events be used to track and improve sales leads?
Setting Up Your Analytics Correctly
Good data starts with good setup. If your setup is wrong, your decisions will be wrong too.
Get the Tracking Code on Your Site
First, you need to put the tracking code on every page of your website. You can do this in a few ways. The easiest way is using Google Tag Manager. This tool lets you manage all your tracking codes in one place . You can also add the code directly to your website files or use a plugin if you have a WordPress site.
Connect Your Other Google Tools
Google Analytics works better when you connect it to other Google tools. Link it to Google Ads. This lets you see which ads lead to sales . You can also connect it to Google Search Console. This shows you which search terms bring people to your site . These connections give you a complete view of your marketing performance.
Keep Your Data Longer
By default, Google Analytics only keeps user data for two months. You can change this to 14 months . This longer time helps you see trends and compare performance year over year. It also helps you understand buying cycles that take a long time.
Set Up Data Retention Correctly
You also need to think about how long you store event data. Go to Data Settings and set the retention period to the maximum . This ensures you have enough historical data to make good decisions.
Finding the Numbers That Actually Matter
Google Analytics gives you a lot of numbers. Most of them are not useful for making marketing decisions. Focus on these key numbers instead.
Total Users
This counts the number of different people who visit your site . Look at this number to see if your audience is growing. If new users are not increasing, you need to find new ways to bring people to your site.
Sessions and Sessions Per User
A session is a group of actions a person takes in a short time . Sessions per user shows how often people come back. More sessions per user means people find your content useful and want to see more.
Engagement Rate
This is one of the most important numbers in the new Google Analytics. A session counts as engaged when someone does one of these things :
Stays on your site for more than 10 seconds
Visits more than one page
Completes a conversion event
A low engagement rate means your content is not holding people's attention. You need to improve your content or make it easier to find.
Average Engagement Time
This shows how long people spend actively looking at your site . This is better than total time on site because it ignores times when people leave the tab open and do nothing. Long engagement time shows people find your content valuable.
Learning Where Your Visitors Come From
You need to know where your visitors come from to make smart marketing decisions. This is called acquisition analysis.
Use the Traffic Acquisition Report
Go to Reports, then Acquisition, then Traffic Acquisition . This report shows you which channels send visitors to your site. Channels include organic search, direct visits, social media, paid ads, and referrals from other sites.
Compare Different Channels
Look at which channels bring the most visitors. Then look at which channels bring the most engaged visitors. Sometimes a channel with fewer visitors brings better quality visitors. For example, maybe social media brings many visitors, but search brings visitors who actually buy things.
Use UTM Codes
UTM codes are tags you add to your links. They tell Google Analytics exactly where the traffic came from. This is very important for tracking your marketing campaigns . Use a consistent naming system. This makes it easy to compare different campaigns.
Here is a simple system to use:
This consistency makes your reports clear and useful.
Understanding What Visitors Do on Your Site
Knowing where visitors come from is just the start. You also need to know what they do once they get to your site.
Use the Pages and Screens Report
Go to Reports, then Engagement, then Pages and Screens . This shows you which pages get the most views and engagement. Sort by average engagement time. The pages at the top are your best content. Study these pages to see what makes them work.
Use Path Exploration
Path exploration is a powerful tool that shows the paths people take through your site . Go to Explore and choose Path Exploration. Start with "session start" as the beginning node. This creates a visual map showing common routes.
Look for places where people drop off. If many people leave after a certain page, you have a problem. Maybe the page is confusing. Maybe it loads slowly. Maybe the next step is not clear.
Look at Landing Pages
Your landing pages are the first pages people see when they come to your site. Go to Reports, then Acquisition, then Traffic Acquisition. Filter by landing page . A page that gets many visitors but has low engagement might have a problem. The page might not match what people were looking for. Fix the page or remove it from your marketing.
Setting Up Events and Conversions
Conversions are the actions you want people to take. This could be buying something, signing up for a newsletter, or filling out a form. In Google Analytics 4, these are called key events .
Define Your Key Events
Start with the most important actions first. What are your business goals? These are your macro-conversions. These might include product purchases, service signups, or quote requests .
Then think about smaller actions that lead to bigger ones. These are micro-conversions. These might include newsletter signups, adding items to a cart, or watching a product video . These smaller actions show that someone is interested. They help you spot potential customers early.
Set Up Events
Google Analytics automatically tracks some events. These include page views and form submissions . For other actions, you need to set up events.
You can do this in the Google Analytics interface. Go to Admin, then Events, then click Create event. Give your event a name. Then set conditions for when the event should trigger .
For example, you could create an event that triggers when someone visits a thank you page after a purchase. The condition could be page title containing "Thank you for your order."
Mark Events as Conversions
Once you have your events set up, go to Admin, then Events . Find your event and turn on the toggle under "Mark as conversion." This tells Google Analytics that this action is important to your business.
You can mark up to 30 events as conversions . Choose carefully. Focus on events that truly matter to your business.
Add Conversion Rate to Reports
By default, Google Analytics shows conversion counts but not rates. You can add conversion rate to your reports . Click the customize report icon, then add metrics. Choose either session conversion rate or user conversion rate.
Session conversion rate is sessions with conversions divided by total sessions. User conversion rate is users who converted divided by total users. Both give useful information.
Read: What are three ways that machine learning is used with data analytics?
Using Audiences to Target the Right People
Audiences are groups of users with something in common. You can use audiences to understand different types of visitors and to target them with marketing.
Create Custom Audiences
Go to Admin, then Audiences, and click New Audience . You can create audiences based on many conditions. Here are some examples:
People who added items to their cart but did not buy
People who visited your pricing page more than three times
People who downloaded a free guide but did not purchase
People who came from a specific marketing campaign
Use the Exclude Function
The exclude function is very useful. You can create an audience of people who added to cart. Then exclude people who completed a purchase . This gives you an audience of people who almost bought but did not. You can target these people with special offers or reminder emails.
Set the Right Membership Duration
This is how long people stay in your audience after they meet the conditions. The default is 30 days. But you might need a different time . Think about your business cycle. If you sell something people need quickly, a shorter time might be better. If you sell something people think about for a long time, a longer time might be better.
Finding and Fixing Problems
Google Analytics can help you spot problems before they become big issues.
Use Custom Insights
Custom insights are alerts you set up. They tell you when something changes . Go to the home page in Google Analytics and scroll down. Click create custom insights.
You can set alerts for things like:
No conversions for 24 hours
Sudden drop in traffic
Change in engagement rate
This helps you catch problems early. You can fix them before they hurt your business.
Use the Funnel Exploration Tool
Funnel exploration shows you where people drop off in a specific process . Go to Explore and choose Funnel Exploration. Set up the steps in your process. For example:
View product page
Add to cart
Begin checkout
Complete purchase
Look at the drop-off at each step. If many people drop off at the checkout step, you might have a problem with your checkout process. Maybe it is too long. Maybe people do not trust your payment system. Use this information to make improvements.
Check DebugView
DebugView is a tool for testing your tracking setup . It shows events in real time. This helps you make sure your events and conversions are set up correctly. Test new changes before you rely on the data.
Making Smarter Marketing Decisions
The goal of all this data is to make better decisions.
Compare Channels by Quality
Do not just look at which channel brings the most visitors. Look at which channel brings the most valuable visitors . A channel might bring fewer visitors but those visitors might be more likely to buy. Focus your budget on these high-quality channels.
Improve Your Content
Use the pages and screens report to see what content people engage with most. Create more content like this . If a blog post has high engagement, write more posts on similar topics. If a video gets many views, make more videos.
Test and Learn
Use Google Analytics to test changes. Make a change to your site. See if engagement improves. See if conversion rates go up . This could be changing a headline, moving a button, or simplifying a form. Keep what works. Change what does not work.
Connect Analytics to Your Marketing Tools
Send your Google Analytics data to your other marketing tools. Use conversions from Google Analytics to inform automated bidding in Google Ads . This helps you spend your ad budget more wisely.
A Practical Action Plan
Here is what to do right now.
This Week
Set up your Google Analytics correctly. Link it to Google Ads and Google Search Console. Check that your events and conversions are tracking properly. Use DebugView to test everything.
This Month
Review your top pages. Find what content gets the most engagement. Make more content like that. Create audience segments for your most valuable visitors. Use these audiences in your marketing campaigns.
This Quarter
Set up custom insights for your important metrics. Start using path exploration to find drop-off points. Fix the biggest problems first. Compare channel performance and reallocate your budget.
Ongoing
Check your key numbers weekly. Look at trends, not just single numbers. Keep testing and learning. Your analytics will get better over time as you collect more data.
Conclusion
Google Analytics is a powerful tool for improving marketing. It shows you what works and what does not. This removes the guesswork from marketing decisions. You can spend your budget where it has the most impact.
Start simple. Get your setup right. Focus on a few key numbers. Make changes based on what the data tells you. Over time, you will get better at using this tool.